Bain Capital Specialty Finance: IIQ 2023 Credit Highlights
No Worries
August 17, 2023
Here are the key credit performance metrics drawn from Bain Capital Specialty Finance's (BCSF) IIQ 2023 earnings conference call; its 10-Q and its earnings press release. In addition, we have tapped the BDC Credit Reporter's own database to identify the BDC's most seriously underperforming companies. You'll see that we're also estimating on a company-by-company basis the ultimate losses the BDC might incur from its most significant borrowers and what that translates into on a per-share basis.
From the BCSF IIQ 2023 earnings conference call.
LENDING ENVIRONMENT
We believe the lending environment for middle-market lenders continues to be attractive given favorable terms and structures that are more lender-friendly.
Ryan Lynch Keefe, Bruyette, & Woods, Inc., Research Division – Managing Director
...You mentioned that you're starting to see a little bit of tightening in spreads, still very attractive spreads in the marketplace, but starting to kind of see a little bit of tightening, which is not uncommon and not something -- and is something we've heard from other platforms out there today. I'm just curious, outside of a little bit of spread tightening, are there any other sort of changes in the quality of deals?
Michael Alexander Ewald Bain Capital Specialty Finance, Inc. – CEO & Director
We're definitely seeing some pressure on that spread, like we said, call it, 25, or 50 basis points. But as you point out, on 11, 12 kind of percent returns at the asset level, that's not really that big a move necessarily.
On the leverage front, that's another pinch point at times. But as you saw, our average for last quarter was about 4.5x. So that's still pretty conservative. That's really driven by the math, given how high rates -- base rates are, how much the company can afford. And cutting 25 basis points out of the spread is really not going to alter that much. So we haven't seen pressure there.
The third pressure point then would be just general documentation, things like covenants. As you know, our philosophy is very much focused on getting financial covenants in over 90% of our deals. So that's certainly at least a term that we would not give on. And other documentation terms like EBITDA definitions and things like that are still, in our estimation, pretty tight and pretty lender friendly.
NAV PER SHARE
NAV per share was $17.44, up from $17.37 at the end of the first quarter, representing a 0.4% increase quarter-over-quarter. The increase in our NAV was driven by the outearning of our dividend, coupled with the relative stability in the value of our investments during the quarter.
UNDERPERFORMING INVESTMENTS
From the 10-Q:
NEW ABL VEHICLE
…We also made an initial equity investment into legacy corporate lending, HoldCo LLC, a new foreign portfolio company created to invest in middle-market ABL loans. By way of background of this new investment, Bain Capital Credit recently announced that it formed a partnership with Legacy Corporate Lending, an independent asset-based lending company focused on serving the needs of North American middle-market borrowers. We believe the ABL space is compelling as the asset class benefits from growing deal volumes and increased nonbank penetration and provides for attractive risk-adjusted returns with differentiated return profiles.
Over the past few years, we have evaluated various acquisition opportunities in whether to buy or build an ABL platform, and we're fortunate to partner with a talented and experienced leadership team, who brings years of ABL and commercial lending experience to build the business organically. While our initial investment in the company is modest, we believe it could be an attractive growth investment for BCSF over time and provides us with a differentiated deal flow in the market, which is tangential and complementary to our existing core middle market corporate focus.
Ryan Lynch Keefe, Bruyette, & Woods, Inc., Research Division – Managing Director
What sort of leverage roughly would you expect to run that to operate that entity at?
Michael John Boyle Bain Capital Specialty Finance, Inc. – President
Yes. So probably between 2x and 3x -- about 2x and 3x leverage.
PORTFOLIO COMPANY PERFORMANCE
Our portfolio companies continue to perform well in light of a more complex operating environment, as demonstrated by stable credit quality metrics across our portfolio with no investments added to non-accrual status during the quarter. Almost 40% of our assets were originated after January 1, 2022, a period when rising rates and higher expectations of an economic slowdown were very much central to the investment decision. Overall, we feel good about the health and quality of our portfolio as our underlying borrowers have largely proven to be defensible, thus far, this year.
This quarter, we remained focused on investing in first-lien senior secured loans with 81% of our new funding within first-lien structures and 15% in investment vehicles, which comprised an additional $30 million contribution to our Senior Loan Program. The remaining 4% was comprised of equity investments, driven primarily by our new investment in Legacy Corporate Lending.
PORTFOLIO
At the end of the second quarter, the size of our portfolio at fair value was approximately $2.4 billion across a highly diversified set of 142 companies operating across 30 different industries. We have continued to grow our diversification by a portfolio company with the highest number of borrowers within our portfolio since inception, growing 16% year-over-year. Our portfolio primarily consists of investments in first-lien loans, given our focus on downside management and investing in the top of capital structures. As of June 30, 64% of the investment portfolio at fair value was invested in first-lien debt, 4% in second-lien debt, 2% in subordinated debt, 4% in preferred equity, and 11% in equity… and 15% in our joint ventures. As we have highlighted to our shareholders in prior earnings calls, the decline in our stated first lien exposure has come down given the growth of our investment vehicles. But notably, 95% of the underlying investments held in these vehicles consist of first-lien loans, resulting in a look-through first-lien exposure of approximately 82% across the entire portfolio.
…Overall, we believe our credit fundamentals remain solid across our portfolio. Our median leverage is 5.1x as of June 30 as compared to 4.9x as of March 31. And our median EBITDA of the portfolio was $58 million.
DEAL STRUCTURES
We remain focused on investing in structures that provide us with strong lender controls. 94% of our investments are structured with documentation, containing financial covenants tied to management forecasts. And we have majority control positions in nearly 80% of our debt tranches, allowing us to drive eventual outcomes at our discretion.
JOINT VENTURE DEVELOPMENTS
During the quarter, we continue to execute our investment strategies within our joint ventures. Our JV investments represented 15% of our overall portfolio at fair value, including 10% in the international Senior Loan Program or ISLP and 5% in the Senior Loan Program, the SLP.
ISLP's investment portfolio as of June 30 was approximately $687 million, comprised of investments in 39 companies. 98% of the portfolio was invested in senior secured floating rate loans. As of June 30, SLP's investment portfolio was approximately $830 million, comprised of investments in 60 different portfolio companies. 100% of that investment portfolio was invested in senior secured loans.
CREDIT QUALITY
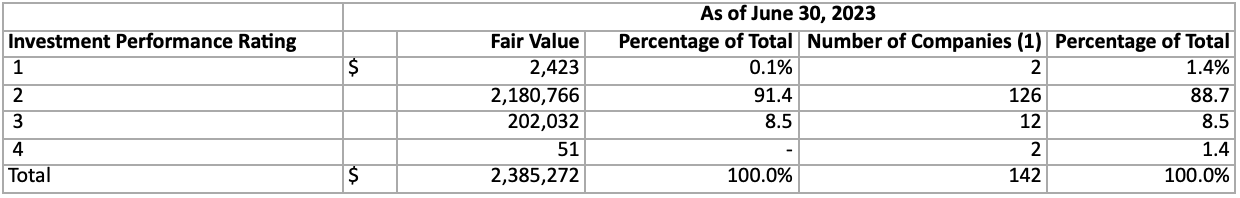
Credit quality was stable quarter-over-quarter. Within our internal risk rating scale, 91% of our portfolio as of June 30 was comprised of risk rating 1 and 2 investments, indicating that the company was performing in line, with or better than expectations relative to our initial underwriting. Risk rating 3 investments comprised 9% of our portfolio at fair value. These investments reflect companies that have been impacted by inflationary impacts and rising interest rates. We remain focused on watching these companies closely. Risk ratings 4 investments comprise 0% of our portfolio at fair value and included 2 portfolio companies on nonaccrual. No new investments were added to nonaccrual during the quarter.
LEVERAGE
As of June 30, our investment portfolio at fair value totaled $2.4 billion and total assets of $2.7 billion. Total net assets were $1.1 billion as of June 30. At the end of Q2, our debt-to-equity ratio was 1.33x as compared to 1.26x at the end of Q1.
Our net leverage ratio, which represents principal debt outstanding less cash, and unsettled trades, was 1.13x at the end of Q2 as compared to 1.16x at the end of Q1. We are comfortable operating in the middle of our .. target leverage ratio between 1 and 1.25x.
FUNDING
As of June 30, approximately 60% of our outstanding debt was in floating rate debt and 40% in fixed rate. The company does not have any debt maturities until 2026, and the weighted average maturity across our total debt commitments was 4.8 years on June 30. Our debt funding continues to benefit from low fixed-rate debt structures as we access the unsecured markets during a period of low-interest rates".
NON-ACCRUAL
As of June 30, 2023, two portfolio companies were on non-accrual status, representing 2.1% and 0.0% of the total investment portfolio at amortized cost and fair value, respectively.- BCSF Earnings Press Release
REALIZED AND UNREALIZED LOSSES
For the three months that ended June 30, 2023...we had net realized losses on investments of ($0.2) million..
..For the three months ended June 30, 2023, we had $23.5 million in unrealized appreciation on 58 portfolio company investments, which was offset by $31.4 million in unrealized depreciation on 83 portfolio company investments. - BCSF 10-Q
CONCLUSION
Good Enough
All the hard and soft data suggest BCSF's credit performance - and its outlook - remains well within "normal" for a BDC. The percentage of underperforming assets (categories 3 & 4 in their four-point rating system) at 8.5% is essentially unchanged from the quarter before and is below the year-end 2022 level, mostly though due to write-downs and write-offs rather than recoveries. The 2 non-accruals in the diversified portfolio have been all but written off and should not impact earnings or NAVPS going forward.
Asterisk
Admittedly, BCSF is close to booking a very large realized loss where Ansira Holdings is concerned, as discussed in an article on August 16, 2023. The damage, though, is in the rear mirror.
Our Survey
We undertook our own independent review of the portfolio, identifying 15 different underperformers. Most, though, were rated 3 on our 5-point scale - the least worrisome underperformance category. That's the same situation as BCSF's own ratings system which has virtually all underperformers in its category 3, indicating very little in the way of investments at dire risk.
Nothing New
Another favorable factor is that there were no new underperformers identified this quarter in that pool of 15 and - as mentioned above by the BDC - no new non-accruals. In fact, no new underperformers have shown up all year.
Who To Worry About
There are only 3 Important Underperformers by our lights: First, there is Ansira, whose FMV has been written down to zero from $33mn a year ago. Then there is building products manufacturer Chase Industries to which BCSF has advanced $16.2mn in first lien loans. Some other BDCs have put their own loans to Chase on non-accrual. BCSF, though, has not and seems optimistic, discounting its debt by (7%). Unfortunately, the BDC has not explained its sanguine valuation.
Finally, there's the much-troubled but restructured Walker-Edison Company. BCSF - and many other BDCs a couple of quarters ago - wrote off a good deal of their debt to the company. Some BDCs have left their positions on non-accrual but not BCSF. The $14mn in remaining first lien loans to the company are valued pretty close to par - hopefully suggesting the furniture maker's business has stabilized since the restructuring.
See the BCSF Important Underperformers database.
Not Much To Worry About
In toto, we calculate that the Important Underperformers have a cost of $76mn and an FMV of $23mn. Going forward, we estimate further losses should be minimal at ($1mn), although ($55mn) in realized losses are likely - almost all due to Ansira. None of these losses should materially impact the BDC's earnings or NAVPS. To all BDCs, some losses must come, but these seem modest and containable.
NAVPS
The BDC's long-term record of maintaining NAV Per Share, since BBDC went public in 2018 - has been average at best - dropping (15%) between the IIIQ 2018 and the IIQ 2023. However, a portion of that NAVPS erosion has to do with issuing shares below book value in 2020 when management was caught flat-footed by the pandemic, as opposed to from credit losses. More recently - over the last 3 quarters - NAVPS has increased in every period. Over the last 12 quarters, BCSF's NAVPS has increased over the prior period 10 times. Net losses in the last three full fiscal years have amounted to under ($17mn), just 6% of Net Investment Income earned over that period.
Looking Forward
With the BDC maintaining a reasonable level of balance sheet leverage; new loans being added with favorable characteristics; only a modest level of underperformers and plans to add "safer" ABL borrowers to the mix, BCSF's credit outlook remains encouraging, both for the rest of 2023 but into the years beyond. We should note, though, that the BDC maintains very large and highly leveraged joint ventures whose total assets are equal to two-thirds of BCSF's own portfolio. We do not undertake a company-by-company evaluation of these JVs but their use of third-party leverage might cause problems down the road.